Market Outlook
February 23, 2017
Market Cues
Domestic Indices
Chg (%)
(Pts)
(Close)
Indian markets are likely to open flat and may remain in green tracking SGX Nifty.
BSE Sensex
0.4
103
28,865
US Markets showed a lack of direction throughout the trading session on
Nifty
0.2
19
8,927
Wednesday before ending the day little changed. Despite the choppy trading on the
Mid Cap
(0.6)
(78)
13,507
day, the Dow still managed to climb to another new record closing high. The
Small Cap
(0.6)
(79)
13,573
lackluster close on Wall Street came following the release of the minutes of the
Federal Reserve's latest monetary policy meeting.
Bankex
0.2
56
23,808
The European markets ended Wednesday's session with mixed results. The markets
climbed to their highest level in 14-months in early trade. Solid German business
Global Indices
Chg (%)
(Pts)
(Close)
sentiment data and a number of positive corporate earnings reports helped to fuel
Dow Jones
0.2
33
20,776
early gains.
Nasdaq
(0.1)
(5)
5,861
Indian markets rose for a fifth consecutive session on Wednesday, as a record rally
FTSE
0.4
27
7,302
in index heavyweight Reliance Industries helped outweigh weakness in the IT sector.
Nikkei
(0.0)
(2)
19,380
Hang Seng
1.0
238
24,202
News Analysis
Shanghai Com
0.2
8
3,261
Maruti Suzuki to invest another `1,900cr on Rohtak centre in 2 years
Detailed analysis on Pg2
Advances / Declines
BSE
NSE
Investor’s Ready Reckoner
Advances
1,103
546
Key Domestic & Global Indicators
Declines
1,778
1,107
Stock Watch: Latest investment recommendations on 150+ stocks
Unchanged
172
59
Refer Pg5 onwards
Top Picks
Volumes (` Cr)
CMP
Target
Upside
Company
Sector
Rating
BSE
3,576
(`)
(`)
(%)
Amara Raja Batteries Auto & Auto Ancillary
Buy
849
1,009
18.8
NSE
26,463
HCL Tech
IT
Buy
837
1,000
19.5
Power Grid Corp.
Power
Accumulate
201
223
10.8
Net Inflows (` Cr)
Net
Mtd
Ytd
Navkar Corp.
Others
Buy
162
265
64.0
FII
-1,954
8,657
8,610
KEI Industries
Others
Buy
172
207
20.2
MFs
1,209
-910
4,305
More Top Picks on Pg3
Key Upcoming Events
Top Gainers
Price (`)
Chg (%)
Previous
Consensus
Date
Region
Event Description
Reliance
1,208
11.0
Reading
Expectations
Wabag
548
4.4
Feb 23 UK
GDP (YoY)
2.00
2.20
Feb 23 Germany GDP nsa (YoY)
1.20
1.20
Ktkbank
128
4.3
Feb 24 US
Consumer Confidence
111.80
110.90
Justdial
531
4.2
Feb 27 US
New home sales
536.00
572.00
Deltacorp
137
4.0
Feb 28 Euro Zone Euro-Zone Consumer Confidence
(6.20)
More Events on Pg4
Top Losers
Price (`)
Chg (%)
Marksans
48
(5.3)
Titan
440
(3.8)
Pageind
13,838
(3.6)
Gppl
157
(3.6)
Jpassociat
14
(3.6)
As on February 22, 2017
Market Outlook
February 23, 2017
News Analysis
Maruti Suzuki to invest another `1,900cr on Rohtak centre in
2 years
The country's largest carmaker Maruti Suzuki India (MSI) is investing another
`1,900cr till March 2019 on enhancing the R&D centre in Rohtak for cutting time
of new product development and to expand infrastructure for evaluating vehicles'
safety.
The company has already invested around `1,900cr on the first phase of
development at the R&D centre that houses various facilities, including vehicle
testing and evaluation labs. In the second phase it will have facilities dedicated for
transmissions, engines, emissions controls among others. These will come up at
the centre over the next few years. The company had completed the first phase of
development at Rohtak centre in November 2015.
Economic and Political News
Finance Ministry to finalise capital infusion of `8K cr within 15 days
GST adoption could raise India's GDP to over 8%: IMF
India needs to create bad bank quickly: Arvind Subramanian
India expected to be among top performing wealth markets till 2026: Report
Corporate News
Airtel picks up stake in fintech startup Seynse
Abbott plans to launch device that can detect traumatic brain injury
Indian Oil may regularly export jet fuel; offers rare cargo
Captives cut outsourcing to Indian IT to solve digital challenges inhouse
Market Outlook
February 23, 2017
Top Picks ★★★★★
Large Cap
Market Cap
CMP
Target
Upside
Company
Rationale
(` Cr)
(`)
(`)
(%)
To outpace battery industry growth due to better
Amara Raja Batteries
14,510
849
1,009
18.8
technological products leading to market share gains in both
the automotive OEM and replacement segments.
The stock is trading at attractive valuations and is factoring
HCL Tech
1,18,089
837
1,000
19.5
all the bad news.
Back on the growth trend, expect a long term growth of 14%
Infosys
2,27,822
992
1,249
25.9
to be a US$20bn in FY2020.
Strong order backlog and improvement in execution would
Larsen & Toubro
1,37,822
1,477
1,634
10.6
trigger the growth for the L&T
One of the largest pharma companies with strong
Lupin
65,675
1,455
1,809
24.4
international presence. It has a rich pipeline of ANDAs which
is also one of the largest among the generic companies.
Going forward, we expect the company to report strong
Power Grid Corporation
1,05,312
201
223
10.8
top-line CAGR of ~16% and bottom-line CAGR of ~19%
over FY16-18 on back of strong capitalization guidance
Source: Company, Angel Research
Mid Cap
Market Cap
CMP
Target
Upside
Company
Rationale
(` Cr)
(`)
(`)
(%)
We expect the company would report strong profitability
Asian Granito
844
281
351
25.1
owing to better product mix, higher B2C sales and
amalgamation synergy.
Among the top 4 players in the consumer durables segment.
Bajaj Electricals
2,646
261
295
12.8
Improved profitability backed by turn around in E&P segment.
Strong order book lends earnings visibility.
Favourable outlook for the AC industry to augur well for
Cooling products business which is out pacing the market
Blue Star
5,330
558
634
13.7
growth. EMPPAC division's profitability to improve once
operating environment turns around.
With a focus on the low and medium income (LMI) consumer
Dewan Housing Finance
9,940
317
350
10.3
segment, the company has increased its presence in tier-II &
III cities where the growth opportunity is immense.
Strong loan growth backed by diversified loan portfolio and
Equitas Holdings
6,059
180
235
30.9
adequate CAR. ROE & ROA likely to remain decent as risk of
dilution remains low. Attractive valuations considering growth.
Economic recovery to have favourable impact on advertising
& circulation revenue growth. Further, the acquisition of a
Jagran Prakashan
6,130
188
225
20.0
radio business (Radio City) would also boost the company's
revenue growth.
High order book execution in EPC segment, rising B2C sales
KEI Industries
1,340
172
207
20.2
and higher exports to boost the revenues and profitability
Speedier execution and speedier sales, strong revenue visibilty
Mahindra Lifespace
1,425
347
522
50.3
in short-to-long run, attractive valuations
Higher growth in domestic branded sales and healthy export
Mirza International
1,100
91
107
17.1
to boost the profitability.
Massive capacity expansion along with rail advantage at ICD
Navkar Corporation
2,305
162
265
64.0
as well CFS augurs well for the company
Market leadership in Hindi news genre and no. 2 viewership
ranking in English news genre, exit from the radio business,
TV Today Network
1,559
261
385
47.3
and anticipated growth in ad spends by corporates to benefit
the stock.
Source: Company, Angel Research
Market Outlook
February 23, 2017
Key Upcoming Events
Global economic events release calendar
Bloomberg Data
Date
Time
Country
Event Description
Unit
Period
Last Reported
Estimated
Feb 23, 2017
3:00 PM UK
GDP (YoY)
% Change 4Q P
2.00
2.20
12:30 PM Germany GDP nsa (YoY)
% Change 4Q F
1.20
1.20
Feb 24, 2017
8:30 PM US
Consumer Confidence
S.A./ 1985=100 Feb
111.80
110.90
Feb 27, 2017
8:30 PM US
New home sales
Thousands
Jan
536.00
572.00
Feb 28, 2017
3:30 PM Euro Zone Euro-Zone Consumer Confidence
Value
Feb F
-6.20
7:00 PM US
GDP Qoq (Annualised)
% Change 4Q S
1.90
2.10
Mar 01, 2017
2:25 PM Germany PMI Manufacturing
Value
Feb F
57.00
2:25 PM Germany Unemployment change (000's)
Thousands
Feb
-26.00
3:00 PM UK
PMI Manufacturing
Value
Feb
55.90
6:30 AM China
PMI Manufacturing
Value
Feb
51.30
51.10
Mar 03, 2017
2:25 PM Germany PMI Services
Value
Feb F
54.40
Mar 07, 2017
3:30 PM Euro Zone Euro-Zone GDP s.a. (QoQ)
% Change 4Q F
0.40
Mar 08, 2017
China
Exports YoY%
% Change
Feb
7.90
Mar 09, 2017
7:00 AM China
Consumer Price Index (YoY)
% Change
Feb
2.50
India
Imports YoY%
% Change
Feb
10.70
Mar 10, 2017
6:15 PM Euro Zone ECB announces interest rates
%
Mar 9
0.00
India
Exports YoY%
% Change
Feb
4.30
3:00 PM UK
Industrial Production (YoY)
% Change
Jan
4.30
5:30 PM India
Industrial Production YoY
% Change
Jan
-0.40
Source: Bloomberg, Angel Research
Market Outlook
February 23, 2017
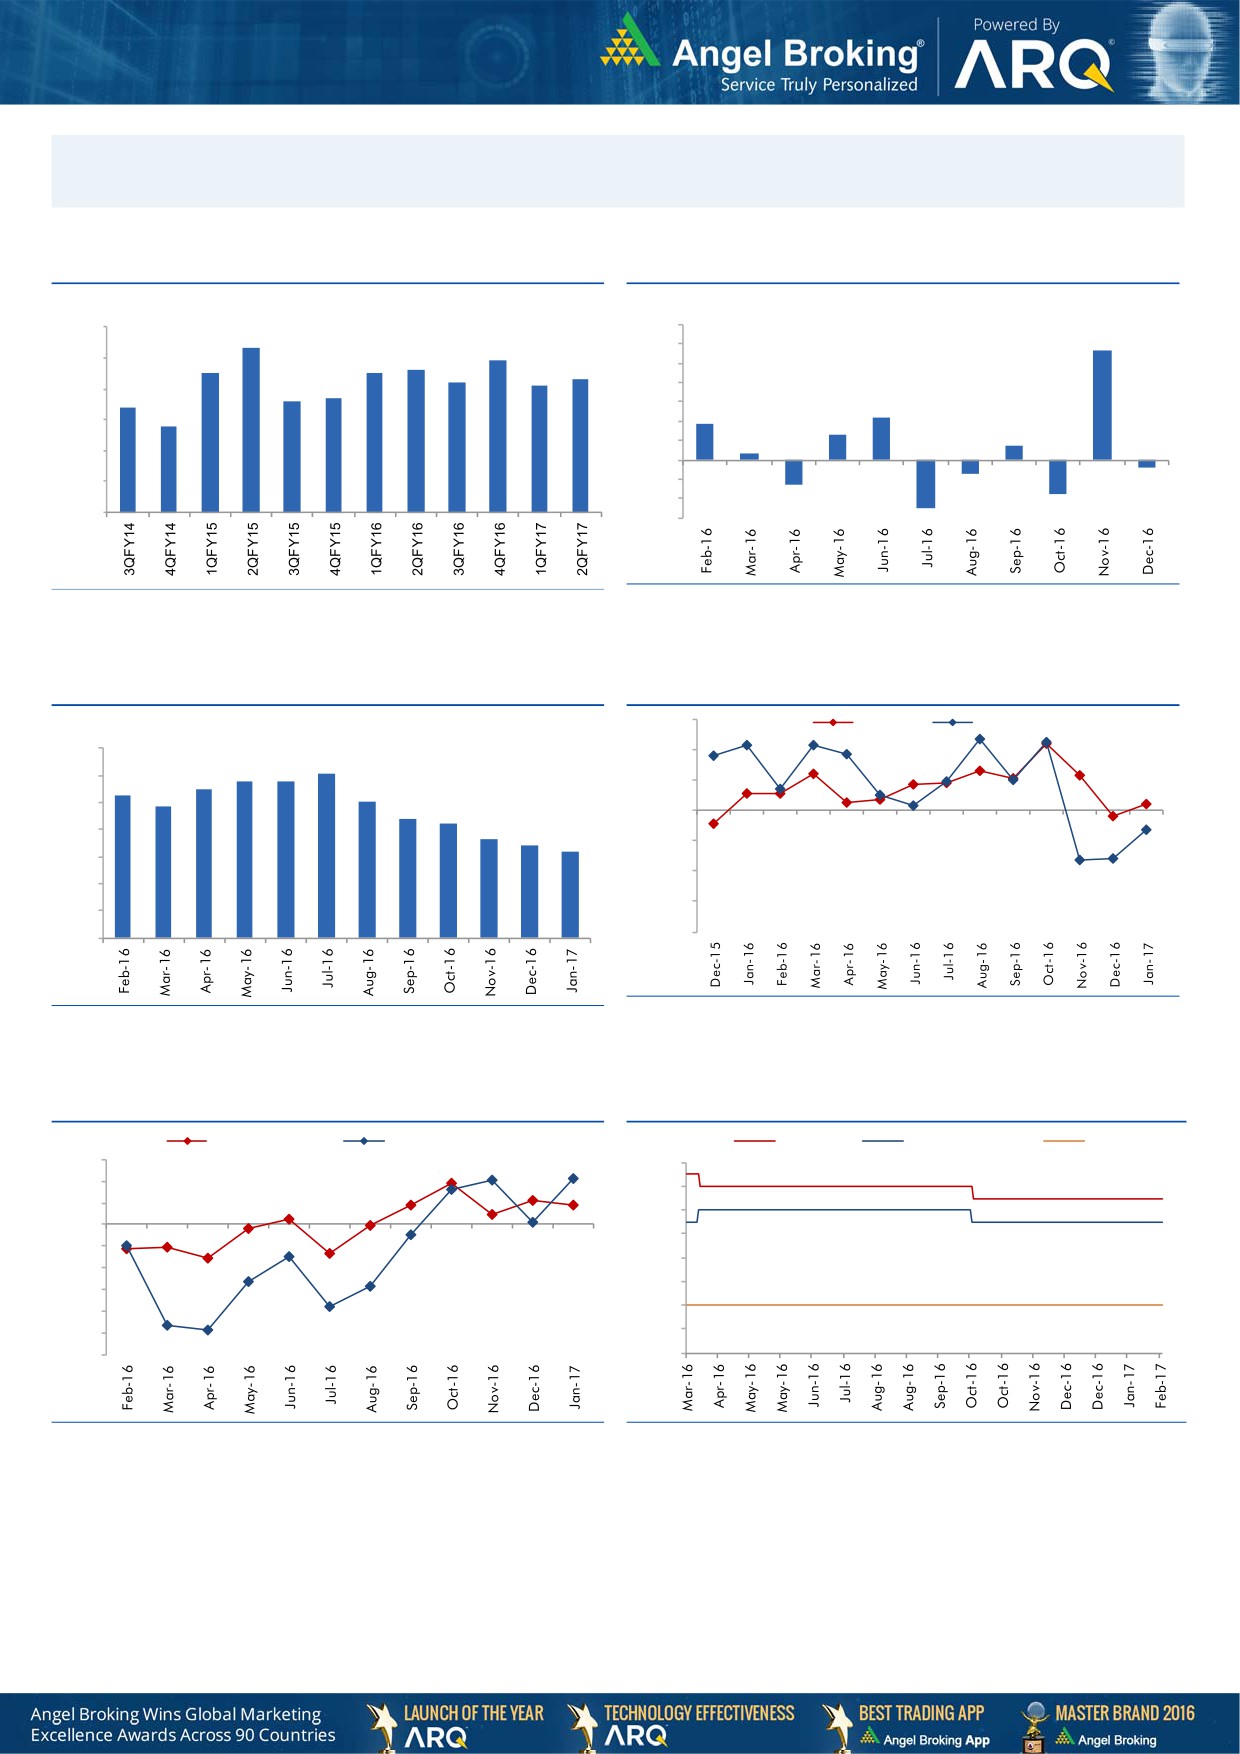
Macro watch
Exhibit 1: Quarterly GDP trends
Exhibit 2: IIP trends
(%)
(%)
9.0
7.0
8.3
5.7
7.9
6.0
8.0
7.5
7.5
7.6
7.3
5.0
7.2
7.1
6.6
6.7
4.0
7.0
6.4
3.0
2.2
5.8
1.9
6.0
2.0
1.3
0.7
1.0
0.3
5.0
-
4.0
(1.0)
(0.7)
(0.4)
(2.0)
(1.3)
3.0
(1.8)
(3.0)
(2.5)
Source: MOSPI, Angel Research
Source: CSO, Angel Research
Exhibit 3: Monthly CPI inflation trends
Exhibit 4: Manufacturing and services PMI
56.0
Mfg. PMI
Services PMI
(%)
7.0
54.0
6.1
5.8
5.8
6.0
5.5
5.3
5.1
52.0
4.8
5.0
4.4
4.2
50.0
3.6
4.0
3.4
3.2
48.0
3.0
46.0
2.0
44.0
1.0
42.0
-
Source: Market, Angel Research; Note: Level above 50 indicates expansion
Source: MOSPI, Angel Research
Exhibit 5: Exports and imports growth trends
Exhibit 6: Key policy rates
(%)
Exports yoy growth
Imports yoy growth
(%)
Repo rate
Reverse Repo rate
CRR
15.0
7.00
10.0
6.50
5.0
6.00
0.0
5.50
(5.0)
5.00
(10.0)
4.50
(15.0)
4.00
(20.0)
(25.0)
3.50
(30.0)
3.00
Source: Bloomberg, Angel Research
Source: RBI, Angel Research
Market Outlook
February 23, 2017
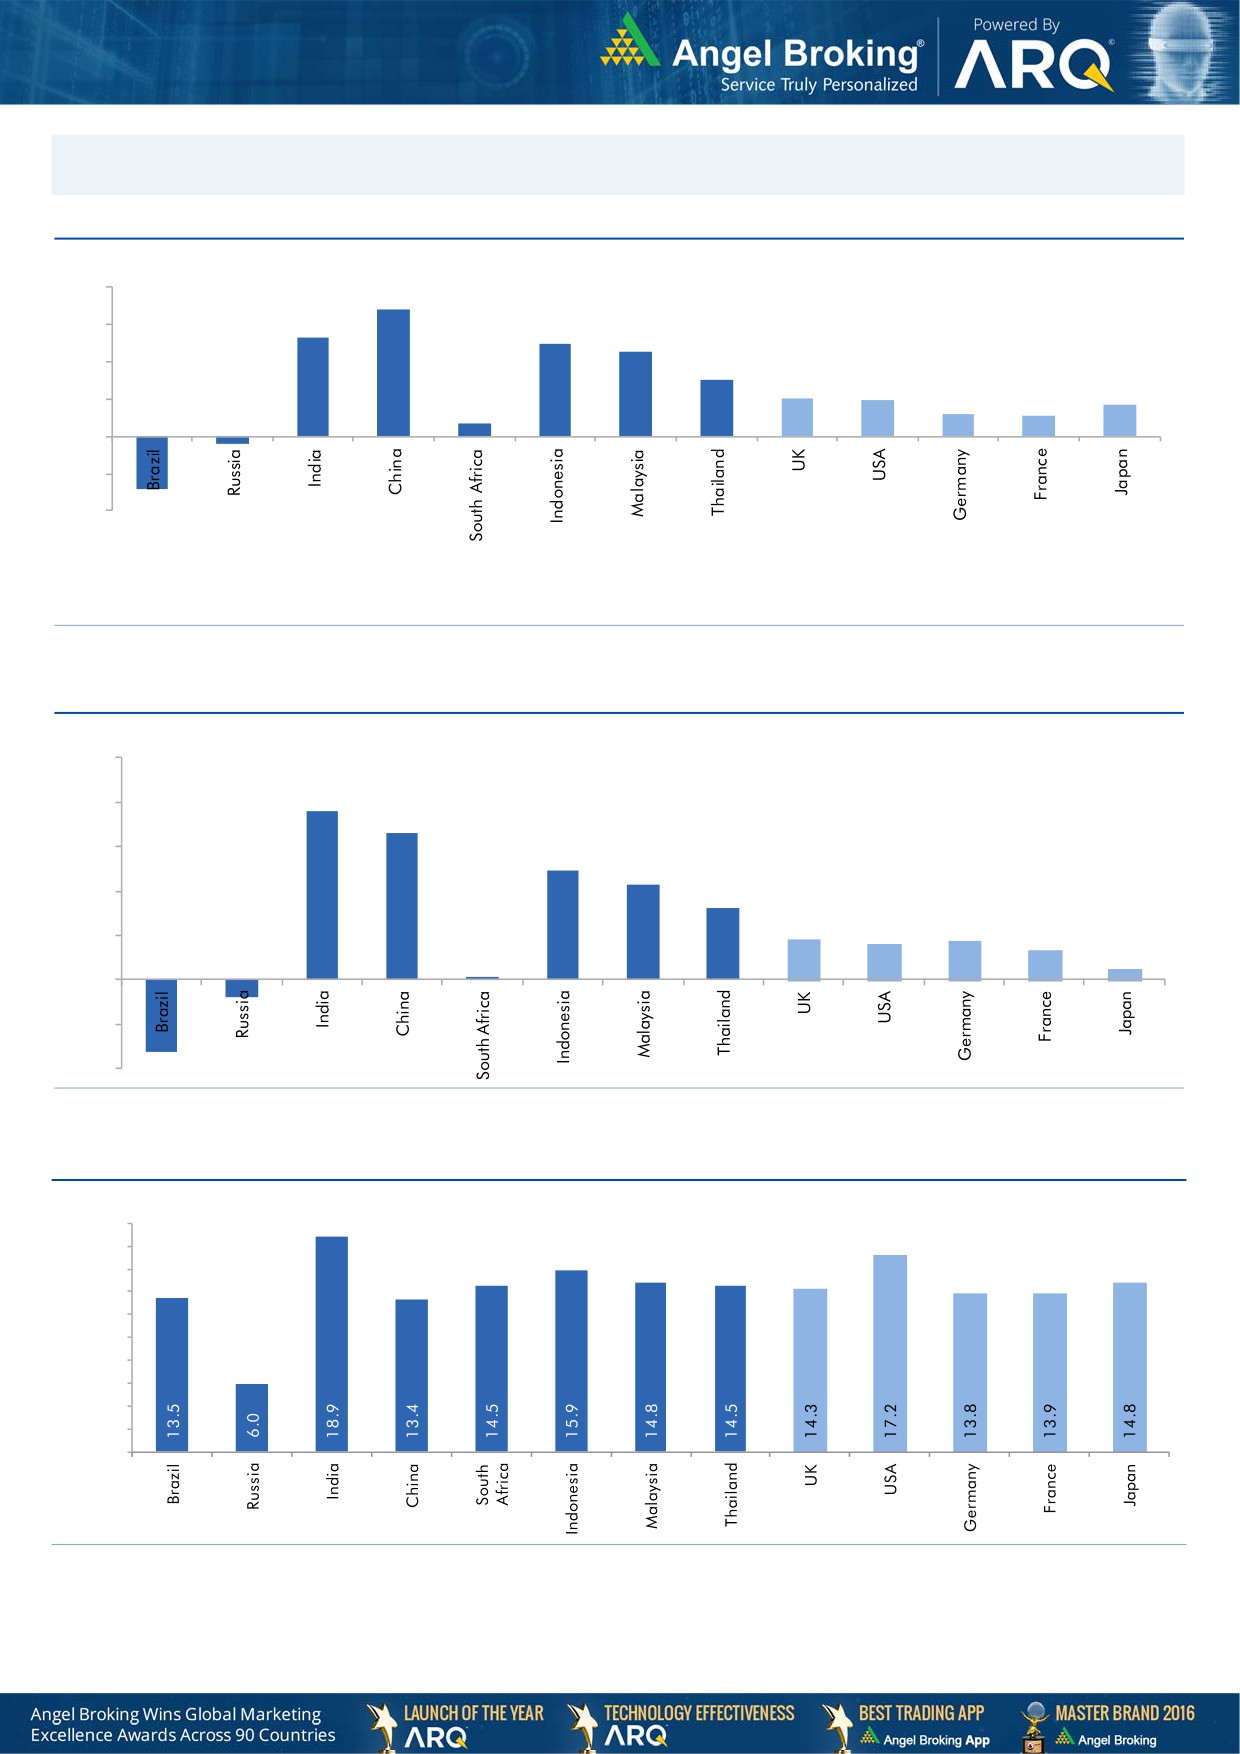
Global watch
Exhibit 1: Latest quarterly GDP Growth (%, yoy) across select developing and developed countries
(%)
8.0
6.8
0.7
5.3
6.0
4.9
4.5
4.0
3.0
2.0
1.9
1.2
1.7
1.1
2.0
-
(2.0)
(0.4)
(4.0)
(2.9)
Source: Bloomberg, Angel Research
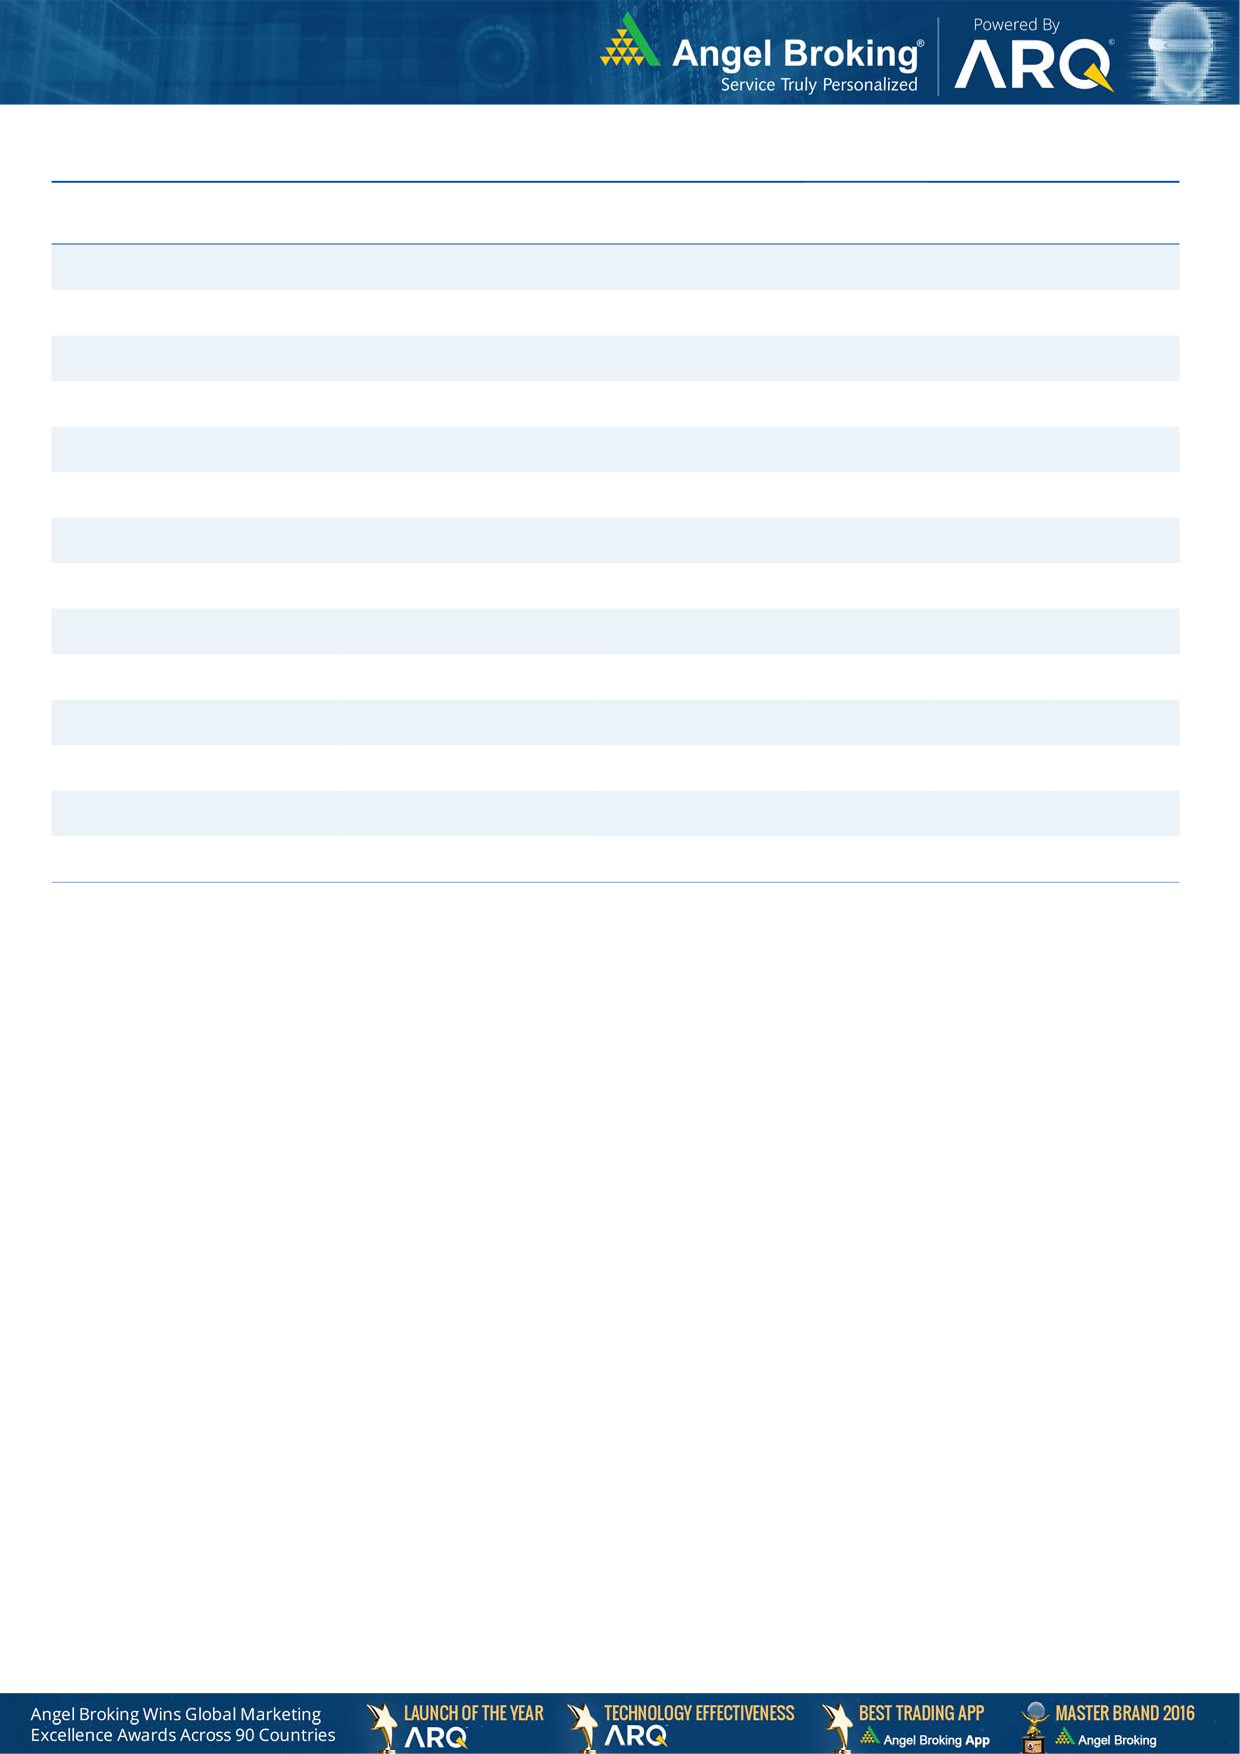
Exhibit 2: 2016 GDP Growth projection by IMF (%, yoy) across select developing and developed countries
(%)
10.0
7.6
8.0
6.6
6.0
4.9
4.3
4.0
3.2
1.8
1.7
1.6
1.3
2.0
(0.8)
0.5
(3.3)
0.1
-
(2.0)
(4.0)
Source: IMF, Angel Research
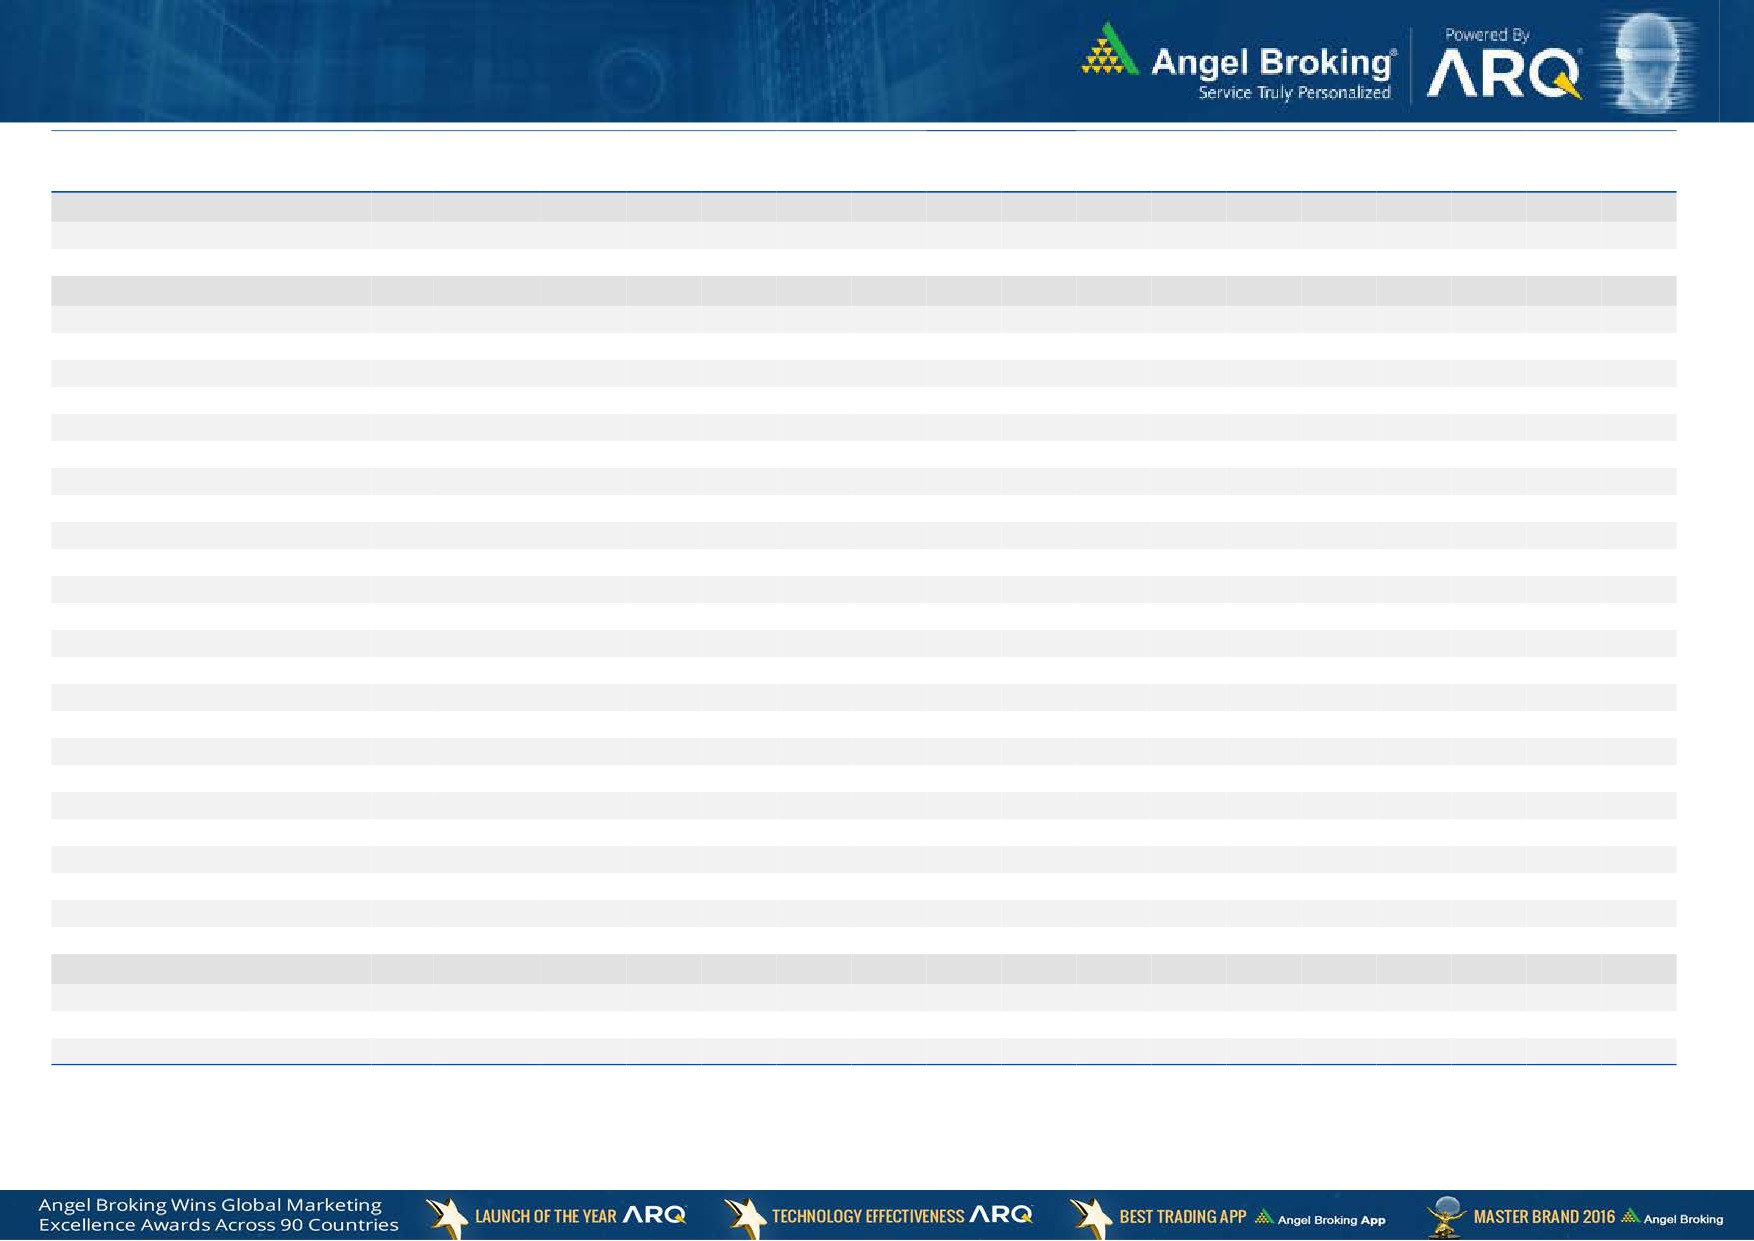
Exhibit 3: One year forward P-E ratio across select developing and developed countries
(x)
20.0
18.0
16.0
14.0
12.0
10.0
8.0
6.0
4.0
2.0
-
Source: IMF, Angel Research
Market Outlook
February 23, 2017
Exhibit 4: Relative performance of indices across globe
Returns (%)
Country
Name of index
Closing price
1M
3M
1YR
Brazil
Bovespa
68,590
6.3
10.7
63.0
Russia
Micex
2,106
(1.9)
1.0
15.9
India
Nifty
8,927
6.9
11.1
25.6
China
Shanghai Composite
3,261
4.8
1.5
18.6
South Africa
Top 40
45,074
(2.5)
1.9
3.7
Mexico
Mexbol
47,196
1.9
5.2
8.7
Indonesia
LQ45
892
1.6
3.2
6.5
Malaysia
KLCI
1,708
2.6
4.9
2.6
Thailand
SET 50
987
1.5
7.5
20.1
USA
Dow Jones
20,776
4.8
9.9
26.0
UK
FTSE
7,302
2.1
7.7
21.4
Japan
Nikkei
19,380
2.6
8.5
21.0
Germany
DAX
11,999
3.9
12.5
23.5
France
CAC
4,896
1.5
8.1
10.9
Source: Bloomberg, Angel Research
Stock Watch
February 23, 2017
Company Name
Reco
CMP
Target
Mkt Cap
Sales ( Čcr )
OPM(%)
EPS (Č)
PER(x)
P/BV(x)
RoE(%)
EV/Sales(x)
(Č)
Price ( Č)
( Č cr )
FY17E FY18E
FY17E
FY18E
FY17E
FY18E
FY17E
FY18E
FY17E
FY18E
FY17E
FY18E
FY17E
FY18E
Agri / Agri Chemical
Rallis
Neutral
241
-
4,689
1,937
2,164
13.3
14.3
9.0
11.0
26.8
21.9
4.7
4.1
18.4
19.8
2.5
2.2
United Phosphorus
Neutral
708
-
35,912
15,176
17,604
18.5
18.5
37.4
44.6
18.9
15.9
3.7
3.1
21.4
21.2
2.5
2.1
Auto & Auto Ancillary
Ashok Leyland
Buy
92
111
26,296
20,021
21,915
11.6
11.9
4.5
5.3
20.5
17.4
4.2
3.7
20.6
21.5
1.3
1.1
Bajaj Auto
Neutral
2,800
-
81,017
25,093
27,891
19.5
19.2
143.9
162.5
19.5
17.2
5.5
4.7
30.3
29.4
3.0
2.6
Bharat Forge
Neutral
1,064
-
24,770
7,726
8,713
20.5
21.2
35.3
42.7
30.1
24.9
5.6
5.0
18.9
20.1
3.3
2.8
Eicher Motors
Neutral
25,070
-
68,217
16,583
20,447
17.5
18.0
598.0
745.2
41.9
33.6
14.3
10.9
41.2
38.3
3.9
3.1
Gabriel India
Accumulate
114
130
1,638
1,544
1,715
9.0
9.3
5.4
6.3
21.1
18.1
4.0
3.5
18.9
19.5
1.0
0.9
Hero Motocorp
Accumulate
3,165
3,446
63,200
28,083
30,096
15.3
15.7
171.8
187.0
18.4
16.9
6.4
5.4
30.1
27.9
2.1
1.9
Jamna Auto Industries Neutral
200
-
1,593
1,486
1,620
9.8
9.9
15.0
17.2
13.3
11.6
2.9
2.5
21.8
21.3
1.1
1.0
L G Balakrishnan & Bros Neutral
574
-
900
1,302
1,432
11.6
11.9
43.7
53.0
13.1
10.8
1.9
1.7
13.8
14.2
0.8
0.7
Mahindra and Mahindra Neutral
1,311
-
81,444
46,534
53,077
11.6
11.7
67.3
78.1
19.5
16.8
3.2
2.8
15.4
15.8
1.7
1.5
Maruti
Accumulate
6,079
6,560
183,644
67,822
83,288
16.0
16.4
253.8
312.4
24.0
19.5
5.5
4.5
23.0
22.9
2.4
1.9
Minda Industries
Neutral
394
-
3,126
2,728
3,042
9.0
9.1
68.2
86.2
5.8
4.6
1.3
1.0
23.8
24.3
1.2
1.0
Motherson Sumi
Neutral
351
-
49,322
45,896
53,687
7.8
8.3
13.0
16.1
27.0
21.8
8.7
6.9
34.7
35.4
1.1
1.0
Rane Brake Lining
Neutral
964
-
763
511
562
11.3
11.5
28.1
30.9
34.3
31.2
5.2
4.8
15.3
15.0
1.6
1.5
Setco Automotive
Neutral
35
-
468
741
837
13.0
13.0
15.2
17.0
2.3
2.1
0.4
0.3
15.8
16.3
1.0
0.9
Tata Motors
Neutral
460
-
132,861
300,209
338,549
8.9
8.4
42.7
54.3
10.8
8.5
1.7
1.5
15.6
17.2
0.6
0.5
TVS Motor
Neutral
427
-
20,284
13,390
15,948
6.9
7.1
12.8
16.5
33.5
25.8
8.3
6.6
26.3
27.2
1.6
1.3
Amara Raja Batteries
Buy
849
1,009
14,510
5,305
6,100
16.0
16.3
28.4
34.0
29.9
25.0
5.8
4.8
19.3
19.3
2.7
2.4
Exide Industries
Neutral
213
-
18,122
7,439
8,307
15.0
15.0
8.1
9.3
26.3
22.9
3.7
3.3
14.3
16.7
2.1
1.8
Apollo Tyres
Buy
180
235
9,155
12,877
14,504
14.3
13.9
21.4
23.0
8.4
7.8
1.3
1.1
16.4
15.2
0.9
0.8
Ceat
Buy
1,131
1,450
4,576
7,524
8,624
13.0
12.7
131.1
144.3
8.6
7.8
1.6
1.4
19.8
18.6
0.7
0.6
JK Tyres
Neutral
119
-
2,701
7,455
8,056
15.0
15.0
21.8
24.5
5.5
4.9
1.1
0.9
22.8
21.3
0.5
0.4
Swaraj Engines
Neutral
1,374
-
1,706
660
810
15.2
16.4
54.5
72.8
25.2
18.9
7.9
7.1
31.5
39.2
2.4
1.9
Subros
Neutral
200
-
1,200
1,488
1,681
11.7
11.9
6.4
7.2
31.3
27.9
3.3
3.0
10.8
11.4
1.0
0.9
Indag Rubber
Neutral
173
-
454
286
326
19.8
16.8
11.7
13.3
14.8
13.0
2.5
2.3
17.8
17.1
1.3
1.1
Capital Goods
ACE
Neutral
52
-
515
709
814
4.1
4.6
1.4
2.1
37.2
24.8
1.5
1.5
4.4
6.0
0.9
0.8
BEML
Neutral
1,295
-
5,392
3,451
4,055
6.3
9.2
31.4
57.9
41.2
22.4
2.5
2.3
6.3
10.9
1.7
1.4
Bharat Electronics
Neutral
1,511
-
33,740
8,137
9,169
16.8
17.2
58.7
62.5
25.7
24.2
4.0
3.6
44.6
46.3
3.1
2.8
Stock Watch
February 23, 2017
Company Name
Reco
CMP
Target
Mkt Cap
Sales ( Čcr )
OPM(%)
EPS (Č)
PER(x)
P/BV(x)
RoE(%)
EV/Sales(x)
(Č)
Price ( Č)
( Č cr )
FY17E
FY18E
FY17E
FY18E
FY17E
FY18E
FY17E
FY18E
FY17E
FY18E
FY17E
FY18E
FY17E
FY18E
Capital Goods
Voltas
Accumulate
355
407
11,741
6,511
7,514
7.9
8.7
12.9
16.3
27.5
21.8
5.0
4.3
16.7
18.5
1.6
1.3
BGR Energy
Neutral
141
-
1,016
16,567
33,848
6.0
5.6
7.8
5.9
18.1
23.9
1.0
1.0
4.7
4.2
0.2
0.1
BHEL
Neutral
154
-
37,766
28,797
34,742
-
2.8
2.3
6.9
67.1
22.4
1.1
1.1
1.3
4.8
1.0
0.7
Blue Star
Accumulate
558
634
5,330
4,283
5,077
5.9
7.3
14.9
22.1
37.5
25.2
7.3
6.1
20.4
26.4
1.3
1.1
Crompton Greaves
Neutral
67
-
4,190
5,777
6,120
5.9
7.0
3.3
4.5
20.3
14.9
0.9
0.9
4.4
5.9
0.7
0.6
Greaves Cotton
Neutral
156
-
3,816
1,755
1,881
16.8
16.9
7.8
8.5
20.0
18.4
4.0
3.7
20.6
20.9
1.9
1.7
Inox Wind
Neutral
180
-
3,990
5,605
6,267
15.7
16.4
24.8
30.0
7.3
6.0
2.0
1.5
25.9
24.4
0.8
0.6
KEC International
Neutral
166
-
4,274
9,294
10,186
7.9
8.1
9.9
11.9
16.8
14.0
2.5
2.1
15.6
16.3
0.7
0.6
KEI Industries
Buy
172
207
1,340
2,682
3,058
10.4
10.0
11.7
12.8
14.7
13.4
2.9
2.5
20.1
18.2
0.7
0.6
Thermax
Neutral
851
-
10,138
5,421
5,940
7.3
7.3
25.7
30.2
33.1
28.2
4.0
3.7
12.2
13.1
1.8
1.6
VATech Wabag
Buy
548
681
2,987
3,136
3,845
8.9
9.1
26.0
35.9
21.1
15.3
2.6
2.2
13.4
15.9
0.9
0.7
Cement
ACC
Neutral
1,449
-
27,208
11,225
13,172
13.2
16.9
44.5
75.5
32.6
19.2
3.1
2.8
11.2
14.2
2.4
2.1
Ambuja Cements
Neutral
233
-
46,266
9,350
10,979
18.2
22.5
5.8
9.5
40.2
24.5
3.4
3.0
10.2
12.5
5.0
4.2
India Cements
Neutral
168
-
5,148
4,364
4,997
18.5
19.2
7.9
11.3
21.2
14.8
1.5
1.5
8.0
8.5
1.9
1.7
JK Cement
Neutral
882
-
6,165
4,398
5,173
15.5
17.5
31.2
55.5
28.3
15.9
3.4
2.9
12.0
15.5
2.0
1.6
J K Lakshmi Cement
Neutral
393
-
4,624
2,913
3,412
14.5
19.5
7.5
22.5
52.4
17.5
3.2
2.7
12.5
18.0
2.2
1.8
Orient Cement
Neutral
146
-
2,984
2,114
2,558
18.5
20.5
8.1
11.3
18.0
12.9
2.7
2.2
9.0
14.0
2.0
1.6
UltraTech Cement
Neutral
3,775
-
103,607
25,768
30,385
21.0
23.5
111.0
160.0
34.0
23.6
4.3
3.8
13.5
15.8
4.1
3.4
Construction
ITNL
Neutral
102
-
3,347
8,946
10,017
31.0
31.6
8.1
9.1
12.6
11.2
0.5
0.5
4.2
5.0
3.7
3.4
KNR Constructions
Neutral
177
-
2,482
1,385
1,673
14.7
14.0
41.2
48.5
4.3
3.6
0.8
0.7
14.9
15.2
1.9
1.5
Larsen & Toubro
Accumulate
1,477
1,634
137,822
111,017
124,908
11.0
11.0
61.1
66.7
24.2
22.1
2.9
2.7
13.1
12.9
2.3
2.1
Gujarat Pipavav Port
Neutral
157
-
7,588
705
788
52.2
51.7
5.0
5.6
31.4
28.0
3.1
2.8
11.2
11.2
10.4
8.8
Nagarjuna Const.
Neutral
83
-
4,609
8,842
9,775
9.1
8.8
5.3
6.4
15.6
13.0
1.2
1.1
8.2
9.1
0.7
0.6
PNC Infratech
Buy
102
143
2,604
2,350
2,904
13.1
13.2
9.0
8.8
11.3
11.5
0.4
0.4
15.9
13.9
1.2
1.0
Simplex Infra
Neutral
311
-
1,539
6,829
7,954
10.5
10.5
31.4
37.4
9.9
8.3
1.0
0.9
9.9
13.4
0.7
0.6
Power Mech Projects
Neutral
443
-
652
1,801
2,219
12.7
14.6
72.1
113.9
6.1
3.9
1.1
1.0
16.8
11.9
0.4
0.3
Sadbhav Engineering
Accumulate
274
298
4,704
3,598
4,140
10.3
10.6
9.0
11.9
30.5
23.0
3.2
2.8
9.9
11.9
1.6
1.4
NBCC
Neutral
175
-
15,723
7,428
9,549
7.9
8.6
8.2
11.0
21.3
15.9
1.1
0.8
28.2
28.7
1.8
1.4
MEP Infra
Neutral
42
-
676
1,877
1,943
30.6
29.8
3.0
4.2
13.9
9.9
6.7
4.5
0.6
0.6
1.7
1.6
Stock Watch
February 23, 2017
Company Name
Reco
CMP
Target
Mkt Cap
Sales ( Čcr )
OPM(%)
EPS (Č)
PER(x)
P/BV(x)
RoE(%)
EV/Sales(x)
(Č)
Price ( Č)
( Č cr )
FY17E
FY18E
FY17E
FY18E
FY17E
FY18E
FY17E
FY18E
FY17E
FY18E
FY17E
FY18E
FY17E
FY18E
Construction
SIPL
Neutral
93
-
3,274
1,036
1,252
65.5
66.2
(8.4)
(5.6)
3.5
4.0
(22.8)
(15.9)
11.4
9.5
Engineers India
Neutral
151
-
10,169
1,725
1,935
16.0
19.1
11.4
13.9
13.2
10.9
1.8
1.8
13.4
15.3
4.8
4.3
Financials
Axis Bank
Accumulate
524
580
125,458
46,932
53,575
3.5
3.4
32.4
44.6
16.2
11.8
2.1
1.8
13.6
16.5
-
-
Bank of Baroda
Neutral
168
-
38,641
19,980
23,178
1.8
1.8
11.5
17.3
14.6
9.7
1.7
1.4
8.3
10.1
-
-
Canara Bank
Neutral
291
-
15,825
15,225
16,836
1.8
1.8
14.5
28.0
20.1
10.4
1.4
1.1
5.8
8.5
-
-
Can Fin Homes
Accumulate
2,013
2,128
5,358
420
526
3.5
3.5
86.5
107.8
23.3
18.7
5.0
4.1
23.6
24.1
-
-
Cholamandalam Inv. &
Buy
1,018
1,230
15,902
2,012
2,317
6.3
6.3
42.7
53.6
23.8
19.0
3.8
3.2
16.9
18.3
-
-
Fin. Co.
Dewan Housing Finance Accumulate
317
350
9,940
2,225
2,688
2.9
2.9
29.7
34.6
10.7
9.2
1.7
1.5
16.1
16.8
-
-
Equitas Holdings
Buy
180
235
6,059
939
1,281
11.7
11.5
5.8
8.2
31.0
21.9
2.7
2.4
10.9
11.5
-
-
Federal Bank
Neutral
84
-
14,486
8,259
8,995
3.0
3.0
4.3
5.6
19.6
15.0
1.7
1.5
8.5
10.1
-
-
HDFC
Neutral
1,395
-
221,198
11,475
13,450
3.4
3.4
45.3
52.5
30.8
26.6
5.9
5.2
20.2
20.5
-
-
HDFC Bank
Neutral
1,399
-
357,955
46,097
55,433
4.5
4.5
58.4
68.0
24.0
20.6
4.2
3.5
18.8
18.6
-
-
ICICI Bank
Accumulate
286
315
166,475
42,800
44,686
3.1
3.3
18.0
21.9
15.9
13.1
2.2
2.0
11.1
12.3
-
-
Lakshmi Vilas Bank
Accumulate
154
174
2,945
3,339
3,799
2.7
2.8
11.0
14.0
14.0
11.0
1.5
1.3
11.2
12.7
-
-
LIC Housing Finance
Accumulate
560
630
28,238
3,712
4,293
2.6
2.5
39.0
46.0
14.4
12.2
2.7
2.3
19.9
20.1
-
-
Punjab Natl.Bank
Neutral
142
-
30,228
23,532
23,595
2.3
2.4
6.8
12.6
20.9
11.3
3.2
2.3
3.3
6.5
-
-
RBL Bank
Neutral
427
-
15,798
1,783
2,309
2.6
2.6
12.7
16.4
33.6
26.1
3.7
3.3
12.8
13.3
-
-
South Ind.Bank
Neutral
21
-
2,772
6,435
7,578
2.5
2.5
2.7
3.1
7.6
6.6
1.0
0.8
10.1
11.2
-
-
St Bk of India
Neutral
272
-
216,720
88,650
98,335
2.6
2.6
13.5
18.8
20.1
14.5
1.9
1.7
7.0
8.5
-
-
Union Bank
Neutral
147
-
10,116
13,450
14,925
2.3
2.3
25.5
34.5
5.8
4.3
0.8
0.7
7.5
10.2
-
-
Yes Bank
Neutral
1,448
-
61,315
8,978
11,281
3.3
3.4
74.0
90.0
19.6
16.1
3.7
3.2
17.0
17.2
-
-
FMCG
Asian Paints
Neutral
1,020
-
97,843
17,128
18,978
16.8
16.4
19.1
20.7
53.4
49.3
18.6
17.5
34.8
35.5
5.6
5.1
Britannia
Accumulate
3,236
3,626
38,833
9,594
11,011
14.6
14.9
80.3
94.0
40.3
34.4
16.6
12.8
41.2
-
3.9
3.4
Colgate
Accumulate
901
995
24,502
4,605
5,149
23.4
23.4
23.8
26.9
37.9
33.5
21.0
16.4
64.8
66.8
5.2
4.7
Dabur India
Accumulate
270
304
47,552
8,315
9,405
19.8
20.7
8.1
9.2
33.3
29.3
9.3
7.7
31.6
31.0
5.4
4.7
GlaxoSmith Con*
Neutral
5,101
-
21,453
4,350
4,823
21.2
21.4
179.2
196.5
28.5
26.0
7.6
6.4
27.1
26.8
4.3
3.8
Godrej Consumer
Neutral
1,703
-
58,018
10,235
11,428
18.4
18.6
41.1
44.2
41.5
38.5
9.2
7.8
24.9
24.8
5.8
5.1
HUL
Neutral
865
-
187,177
35,252
38,495
17.8
17.8
20.7
22.4
41.9
38.6
40.0
34.3
95.6
88.9
5.2
4.7
ITC
Accumulate
264
284
319,637
40,059
44,439
38.3
39.2
9.0
10.1
29.4
26.0
8.2
7.2
27.8
27.5
7.5
6.7
Stock Watch
February 23, 2017
Company Name
Reco
CMP
Target
Mkt Cap
Sales ( Čcr )
OPM(%)
EPS (Č)
PER(x)
P/BV(x)
RoE(%)
EV/Sales(x)
(Č)
Price ( Č)
( Č cr )
FY17E FY18E
FY17E
FY18E
FY17E
FY18E
FY17E
FY18E
FY17E
FY18E
FY17E
FY18E
FY17E
FY18E
FMCG
Marico
Accumulate
273
300
35,221
6,430
7,349
18.8
19.5
6.4
7.7
42.7
35.5
12.9
10.8
33.2
32.5
5.3
4.6
Nestle*
Neutral
6,396
-
61,671
10,073
11,807
20.7
21.5
124.8
154.2
51.3
41.5
21.0
18.9
34.8
36.7
5.9
5.0
Tata Global
Neutral
140
-
8,836
8,675
9,088
9.8
9.8
7.4
8.2
18.9
17.1
2.1
2.1
7.9
8.1
0.9
0.9
Procter & Gamble
Accumulate
7,015
7,369
22,771
2,939
3,342
23.2
23.0
146.2
163.7
48.0
42.9
107.4
103.0
25.3
23.5
7.3
6.3
Hygiene
IT
HCL Tech^
Buy
837
1,000
118,089
49,242
57,168
20.5
20.5
55.7
64.1
15.0
13.1
3.1
2.3
20.3
17.9
2.3
1.8
Infosys
Buy
992
1,249
227,822
68,350
77,326
27.0
27.0
62.5
69.4
15.9
14.3
3.4
3.1
21.3
21.6
2.8
2.4
TCS
Accumulate
2,410
2,700
474,784
119,025
133,308
27.6
27.6
131.2
145.5
18.4
16.6
6.0
5.5
32.4
33.1
3.8
3.3
Tech Mahindra
Buy
507
600
49,384
29,673
32,937
15.5
17.0
32.8
39.9
15.5
12.7
3.0
2.6
19.6
20.7
1.4
1.2
Wipro
Buy
474
583
115,114
55,440
60,430
18.1
18.1
36.1
38.9
13.1
12.2
2.4
2.2
19.0
17.6
1.8
1.6
Media
D B Corp
Neutral
383
-
7,036
2,297
2,590
27.4
28.2
21.0
23.4
18.2
16.4
4.3
3.7
23.7
23.1
2.9
2.5
HT Media
Neutral
83
-
1,942
2,693
2,991
12.6
12.9
7.9
9.0
10.6
9.3
0.9
0.8
7.8
8.3
0.3
0.2
Jagran Prakashan
Buy
188
225
6,130
2,355
2,635
28.0
28.0
10.8
12.5
17.4
15.0
3.8
3.3
21.7
21.7
2.6
2.3
Sun TV Network
Neutral
697
-
27,454
2,850
3,265
70.1
71.0
26.2
30.4
26.6
22.9
6.8
6.0
24.3
25.6
9.2
7.9
Hindustan Media
Neutral
269
-
1,975
1,016
1,138
24.3
25.2
27.3
30.1
9.9
8.9
1.9
1.7
16.2
15.8
1.3
1.1
Ventures
TV Today Network
Buy
261
385
1,559
637
743
27.5
27.5
18.4
21.4
14.2
12.2
2.5
2.1
17.4
17.2
2.1
1.7
Metals & Mining
Coal India
Neutral
328
-
203,603
84,638
94,297
21.4
22.3
24.5
27.1
13.4
12.1
5.6
5.3
42.6
46.0
1.9
1.7
Hind. Zinc
Neutral
302
-
127,731
14,252
18,465
55.9
48.3
15.8
21.5
19.1
14.1
3.1
2.7
17.0
20.7
9.0
6.9
Hindalco
Neutral
180
-
37,195
107,899
112,095
7.4
8.2
9.2
13.0
19.6
13.9
0.9
0.9
4.8
6.6
0.9
0.8
JSW Steel
Neutral
185
-
44,731
53,201
58,779
16.1
16.2
130.6
153.7
1.4
1.2
0.2
0.2
14.0
14.4
1.6
1.4
NMDC
Neutral
142
-
44,943
6,643
7,284
44.4
47.7
7.1
7.7
20.0
18.5
1.7
1.7
8.8
9.2
4.5
4.1
SAIL
Neutral
61
-
24,987
47,528
53,738
(0.7)
2.1
(1.9)
2.6
23.3
0.7
0.6
(1.6)
3.9
1.4
1.2
Vedanta
Neutral
263
-
77,942
71,744
81,944
19.2
21.7
13.4
20.1
19.6
13.1
1.7
1.5
8.4
11.3
1.5
1.2
Tata Steel
Neutral
483
-
46,939
121,374
121,856
7.2
8.4
18.6
34.3
26.0
14.1
1.6
1.5
6.1
10.1
1.0
1.0
Oil & Gas
Cairn India
Neutral
289
-
54,195
9,127
10,632
4.3
20.6
8.8
11.7
32.8
24.7
1.1
1.0
3.3
4.2
7.4
6.2
GAIL
Neutral
519
-
65,821
56,220
65,198
9.3
10.1
27.1
33.3
19.2
15.6
1.8
1.6
9.3
10.7
1.4
1.1
ONGC
Neutral
196
-
251,018
137,222
152,563
15.0
21.8
19.5
24.1
10.0
8.1
0.9
0.8
8.5
10.1
2.1
1.9
Indian Oil Corp
Neutral
390
-
189,405
373,359
428,656
5.9
5.5
54.0
59.3
7.2
6.6
1.1
1.0
16.0
15.6
0.7
0.6
Reliance Industries
Neutral
1,208
-
391,745
301,963
358,039
12.1
12.6
87.7
101.7
13.8
11.9
1.4
1.3
10.7
11.3
1.8
1.5
Pharmaceuticals
Alembic Pharma
Neutral
583
-
10,994
3,483
4,083
20.2
21.4
24.3
30.4
24.0
19.2
5.5
4.4
25.5
25.3
3.1
2.6
Stock Watch
February 23, 2017
Company Name
Reco
CMP
Target
Mkt Cap
Sales ( Čcr )
OPM(%)
EPS (Č)
PER(x)
P/BV(x)
RoE(%)
EV/Sales(x)
(Č)
Price ( Č)
( Č cr )
FY17E
FY18E
FY17E
FY18E
FY17E
FY18E
FY17E
FY18E
FY17E
FY18E
FY17E
FY18E
FY17E
FY18E
Pharmaceuticals
Alkem Laboratories Ltd
Accumulate
2,023
2,203
24,183
6,065
7,009
18.7
20.0
80.2
92.0
25.2
22.0
5.7
4.8
22.5
21.6
3.9
3.4
Aurobindo Pharma
Buy
678
877
39,666
15,720
18,078
23.7
23.7
41.4
47.3
16.4
14.3
4.3
3.3
29.6
26.1
2.7
2.4
Aventis*
Neutral
4,175
-
9,615
2,277
2,597
17.3
18.3
149.4
172.0
27.9
24.3
4.6
3.7
25.1
28.8
3.9
3.2
Cadila Healthcare
Neutral
435
-
44,487
10,429
12,318
17.7
21.6
13.1
19.2
33.2
22.6
6.9
5.5
22.8
27.1
4.3
3.5
Cipla
Sell
588
465
47,291
15,378
18,089
15.7
16.8
19.3
24.5
30.5
24.0
3.6
3.2
12.3
13.9
3.2
2.7
Dr Reddy's
Neutral
2,899
-
48,031
16,043
18,119
18.0
23.0
78.6
130.9
36.9
22.2
3.6
3.2
10.1
15.2
2.8
2.6
Dishman Pharma
Neutral
229
-
3,693
1,718
1,890
22.7
22.8
9.5
11.3
24.1
20.3
2.3
2.1
10.1
10.9
2.6
2.3
GSK Pharma*
Neutral
2,674
-
22,650
2,800
3,290
10.2
20.6
32.2
60.3
83.0
44.3
15.4
15.2
17.2
34.5
7.9
6.7
Indoco Remedies
Reduce
269
240
2,476
1,112
1,289
16.2
18.2
11.6
16.0
23.2
16.8
3.7
3.1
17.0
20.1
2.4
2.0
Ipca labs
Accumulate
542
613
6,838
3,258
3,747
12.8
15.3
12.1
19.2
44.8
28.2
2.8
2.6
6.4
9.5
2.2
1.9
Lupin
Buy
1,455
1,809
65,675
15,912
18,644
26.4
26.7
58.1
69.3
25.0
21.0
4.9
4.0
21.4
20.9
4.2
3.5
Sun Pharma
Buy
670
847
160,843
31,129
35,258
32.0
32.9
30.2
35.3
22.2
19.0
3.6
3.0
20.0
20.1
4.7
4.0
Power
Tata Power
Neutral
84
-
22,761
36,916
39,557
17.4
27.1
5.1
6.3
16.5
13.4
1.5
1.3
9.0
10.3
1.6
1.5
NTPC
Neutral
167
-
137,369
86,605
95,545
17.5
20.8
11.8
13.4
14.1
12.4
1.4
1.3
10.5
11.1
2.9
2.9
Power Grid
Accumulate
201
223
105,312
25,315
29,193
88.2
88.7
14.2
17.2
14.2
11.7
2.2
1.9
15.2
16.1
8.8
7.9
Real Estate
Prestige Estate
Buy
172
210
6,435
4,707
5,105
25.2
26.0
10.3
13.0
16.7
13.2
1.3
1.2
10.3
10.2
2.5
2.2
MLIFE
Buy
347
522
1,425
1,152
1,300
22.7
24.6
29.9
35.8
11.6
9.7
0.9
0.8
7.6
8.6
2.0
1.6
Telecom
Bharti Airtel
Neutral
361
-
144,366
105,086
114,808
34.5
34.7
12.2
16.4
29.6
22.0
2.0
1.9
6.8
8.4
2.3
2.0
Idea Cellular
Neutral
112
-
40,501
40,133
43,731
37.2
37.1
6.4
6.5
17.6
17.3
1.5
1.4
8.2
7.6
2.0
1.7
zOthers
Abbott India
Neutral
4,523
-
9,612
3,153
3,583
14.1
14.4
152.2
182.7
29.7
24.8
145.9
124.6
25.6
26.1
2.8
2.4
Asian Granito
Buy
281
351
844
1,060
1,169
12.2
12.5
12.7
15.9
22.2
17.7
2.1
1.9
9.5
10.7
1.1
1.0
Bajaj Electricals
Accumulate
261
295
2,647
4,801
5,351
5.7
6.2
10.4
13.7
25.1
19.1
3.1
2.8
12.4
14.5
0.5
0.5
Banco Products (India)
Neutral
202
-
1,448
1,353
1,471
12.3
12.4
14.5
16.3
14.0
12.4
19.3
17.4
14.5
14.6
1.0
108.3
Coffee Day Enterprises
Neutral
231
-
4,758
2,964
3,260
20.5
21.2
4.7
8.0
-
28.9
2.7
2.4
5.5
8.5
2.0
1.8
Ltd
Competent Automobiles Neutral
175
-
108
1,137
1,256
3.1
2.7
28.0
23.6
6.3
7.4
33.7
30.4
14.3
11.5
0.1
0.1
Elecon Engineering
Neutral
54
-
608
1,482
1,660
13.7
14.5
3.9
5.8
13.9
9.3
3.3
3.0
7.8
10.9
0.7
0.6
Finolex Cables
Neutral
441
-
6,742
2,883
3,115
12.0
12.1
14.2
18.6
31.0
23.7
16.5
14.4
15.8
14.6
2.0
1.8
Garware Wall Ropes
Accumulate
659
710
1,443
863
928
15.1
15.2
36.4
39.4
18.1
16.7
3.3
2.8
17.5
15.9
1.6
1.5
Goodyear India*
Neutral
714
-
1,646
1,598
1,704
10.4
10.2
49.4
52.6
14.5
13.6
66.7
58.5
18.2
17.0
0.7
99.3
Stock Watch
February 23, 2017
Company Name
Reco
CMP
Target
Mkt Cap
Sales ( Čcr )
OPM(%)
EPS (Č)
PER(x)
P/BV(x)
RoE(%)
EV/Sales(x)
(Č)
Price ( Č)
( Č cr )
FY17E
FY18E
FY17E
FY18E
FY17E
FY18E
FY17E
FY18E
FY17E
FY18E
FY17E
FY18E
FY17E
FY18E
zOthers
Hitachi
Neutral
1,380
-
3,752
2,081
2,433
8.8
8.9
33.4
39.9
41.3
34.6
33.3
27.8
22.1
21.4
1.8
1.5
HSIL
Neutral
305
-
2,206
2,384
2,515
15.8
16.3
15.3
19.4
20.0
15.7
19.8
17.1
7.8
9.3
1.1
1.0
Interglobe Aviation
Neutral
845
-
30,539
21,122
26,005
14.5
27.6
110.7
132.1
7.6
6.4
45.7
32.6
168.5
201.1
1.4
1.1
Jyothy Laboratories
Neutral
355
-
6,442
1,440
2,052
11.5
13.0
8.5
10.0
41.7
35.5
10.1
9.4
18.6
19.3
4.8
3.3
Kirloskar Engines India
Neutral
350
-
5,061
2,554
2,800
9.9
10.0
10.5
12.1
33.3
28.9
13.9
13.2
10.7
11.7
1.6
1.4
Ltd
Linc Pen & Plastics
Neutral
251
-
372
382
420
9.3
9.5
13.5
15.7
18.7
16.0
3.2
2.8
17.1
17.3
1.0
0.9
M M Forgings
Neutral
463
-
559
546
608
20.4
20.7
41.3
48.7
11.2
9.5
63.5
56.2
16.6
17.0
0.9
0.8
Manpasand Bever.
Neutral
695
-
3,977
836
1,087
19.6
19.4
16.9
23.8
41.1
29.2
4.9
4.3
12.0
14.8
4.5
3.4
Mirza International
Buy
91
107
1,100
1,024
1,148
18.0
18.0
6.9
8.0
13.3
11.4
2.2
1.9
16.6
16.3
1.3
1.1
MT Educare
Neutral
99
-
395
366
417
17.7
18.2
9.4
10.8
10.6
9.2
2.4
2.1
22.2
22.3
1.0
0.8
Narayana Hrudaya
Neutral
322
-
6,587
1,873
2,166
11.5
11.7
2.6
4.0
121.9
81.3
7.5
6.8
6.1
8.3
3.6
3.1
Navkar Corporation
Buy
162
265
2,305
369
561
42.9
42.3
7.2
11.5
22.4
14.0
1.6
1.5
7.4
10.5
7.3
4.8
Navneet Education
Neutral
143
-
3,331
1,062
1,147
24.0
24.0
6.1
6.6
23.4
21.5
4.8
4.3
20.6
19.8
3.2
3.0
Nilkamal
Neutral
1,757
-
2,622
1,995
2,165
10.7
10.4
69.8
80.6
25.2
21.8
100.4
87.2
16.6
16.5
1.3
1.2
Page Industries
Neutral
13,881
-
15,483
2,450
3,124
20.1
17.6
299.0
310.0
46.4
44.8
309.2
236.0
47.1
87.5
6.4
5.0
Parag Milk Foods
Neutral
224
-
1,881
1,919
2,231
9.3
9.6
9.5
12.9
23.7
17.3
3.7
3.0
15.5
17.5
1.1
1.0
Quick Heal
Neutral
253
-
1,771
408
495
27.3
27.0
7.7
8.8
32.6
28.7
3.0
3.0
9.3
10.6
3.5
2.9
Radico Khaitan
Accumulate
133
147
1,768
1,667
1,824
13.0
13.2
6.7
8.2
20.0
16.2
1.8
1.7
9.0
10.2
1.5
1.3
Relaxo Footwears
Neutral
424
-
5,091
2,085
2,469
9.2
8.2
7.6
8.0
56.1
53.3
21.7
18.6
17.9
18.8
2.5
2.2
S H Kelkar & Co.
Neutral
302
-
4,365
1,036
1,160
15.1
15.0
6.1
7.2
49.4
42.1
5.3
4.8
10.7
11.5
4.1
3.6
Siyaram Silk Mills
Neutral
1,701
-
1,594
1,652
1,857
11.6
11.7
92.4
110.1
18.4
15.4
2.7
2.4
14.7
15.2
1.2
1.0
Styrolution ABS India*
Neutral
603
-
1,060
1,440
1,537
9.2
9.0
40.6
42.6
14.9
14.2
37.9
34.5
12.3
11.6
0.7
0.6
Surya Roshni
Neutral
194
-
851
3,342
3,625
7.8
7.5
17.3
19.8
11.2
9.8
21.3
17.1
10.5
10.8
0.5
0.5
Team Lease Serv.
Neutral
863
-
1,475
3,229
4,001
1.5
1.8
22.8
32.8
37.9
26.3
4.1
3.5
10.7
13.4
0.4
0.3
The Byke Hospitality
Neutral
180
-
722
287
384
20.5
20.5
7.6
10.7
23.7
16.8
5.0
4.0
20.7
23.5
2.5
1.9
Transport Corporation of
Neutral
208
-
1,589
2,671
2,911
8.5
8.8
13.9
15.7
15.0
13.3
2.1
1.8
13.7
13.8
0.7
0.6
India
TVS Srichakra
Neutral
3,053
-
2,338
2,304
2,614
13.7
13.8
231.1
266.6
13.2
11.5
343.0
270.1
33.9
29.3
1.0
0.9
UFO Moviez
Neutral
411
-
1,134
619
685
33.2
33.4
30.0
34.9
13.7
11.8
1.9
1.6
13.8
13.9
1.5
1.2
Visaka Industries
Neutral
221
-
352
1,051
1,138
10.3
10.4
21.0
23.1
10.5
9.6
28.4
26.6
9.0
9.2
0.6
0.6
Stock Watch
February 23, 2017
Company Name
Reco
CMP
Target Mkt Cap
Sales ( Čcr )
OPM(%)
EPS (Č)
PER(x)
P/BV(x)
RoE(%)
EV/Sales(x)
(Č)
Price ( Č)
( Č cr )
FY17E FY18E FY17E FY18E FY17E FY18E FY17E FY18E FY17E FY18E FY17E FY18E FY17E FY18E
zOthers
VRL Logistics
Neutral
294
-
2,682
1,902
2,119
16.7
16.6
14.6
16.8
20.2
17.5
4.4
3.9
21.9
22.2
1.5
1.3
Wonderla Holidays
Neutral
374
-
2,116
287
355
38.0
40.0
11.3
14.2
33.1
26.4
4.8
4.2
21.4
23.9
7.1
5.7
Source: Company, Angel Research; Note: *December year end; #September year end; &October year end; Price as on February 22, 2017
Market Outlook
February 23, 2017
Research Team Tel: 022 - 39357800
DISCLAIMER
Angel Broking Private Limited (hereinafter referred to as “Angel”) is a registered Member of National Stock Exchange of India
Limited,Bombay Stock Exchange Limited and Metropolitan Stock Exchange Limited. It is also registered as a Depository Participant with
CDSL and Portfolio Manager with SEBI. It also has registration with AMFI as a Mutual Fund Distributor. Angel Broking Private Limited is a
registered entity with SEBI for Research Analyst in terms of SEBI (Research Analyst) Regulations, 2014 vide registration number
INH000000164. Angel or its associates has not been debarred/ suspended by SEBI or any other regulatory authority for accessing
/dealing in securities Market. Angel or its associates/analyst has not received any compensation / managed or
co-managed public offering of securities of the company covered by Analyst during the past twelve months.
This document is solely for the personal information of the recipient, and must not be singularly used as the basis of any investment
decision. Nothing in this document should be construed as investment or financial advice. Each recipient of this document should make
such investigations as they deem necessary to arrive at an independent evaluation of an investment in the securities of the companies
referred to in this document (including the merits and risks involved), and should consult their own advisors to determine the merits and
risks of such an investment.
Reports based on technical and derivative analysis center on studying charts of a stock's price movement, outstanding positions and
trading volume, as opposed to focusing on a company's fundamentals and, as such, may not match with a report on a company's
fundamentals. Investors are advised to refer the Fundamental and Technical Research Reports available on our website to evaluate the
contrary view, if any.
The information in this document has been printed on the basis of publicly available information, internal data and other reliable
sources believed to be true, but we do not represent that it is accurate or complete and it should not be relied on as such, as this
document is for general guidance only. Angel Broking Pvt. Limited or any of its affiliates/ group companies shall not be in any way
responsible for any loss or damage that may arise to any person from any inadvertent error in the information contained in this report.
Angel Broking Pvt. Limited has not independently verified all the information contained within this document. Accordingly, we cannot
testify, nor make any representation or warranty, express or implied, to the accuracy, contents or data contained within this document.
While Angel Broking Pvt. Limited endeavors to update on a reasonable basis the information discussed in this material, there may be
regulatory, compliance, or other reasons that prevent us from doing so.
This document is being supplied to you solely for your information, and its contents, information or data may not be reproduced,
redistributed or passed on, directly or indirectly.
Neither Angel Broking Pvt. Limited, nor its directors, employees or affiliates shall be liable for any loss or damage that may arise from
or in connection with the use of this information.